Tampilkan postingan dengan label J curve. Tampilkan semua postingan

Senin, 28 Januari 2013

How much alcohol is optimal? Maybe less than you think

I have been regularly recommending to users of the software HCE () to include a column in their health data reflecting their alcohol consumption. Why? Because I suspect that alcohol consumption is behind many of what we call the “diseases of affluence”.

A while ago I recall watching an interview with a centenarian, a very lucid woman. When asked about her “secret” to live a long life, she said that she added a little bit of whiskey to her coffee every morning. It was something like a tablespoon of whiskey, or about 15 g, which amounted to approximately 6 g of ethanol every single day.

Well, she might have been drinking very close to the optimal amount of alcohol per day for the average person, if the study reviewed in this post is correct.

Studies of the effect of alcohol consumption on health generally show results in terms of averages within fixed ranges of consumption. For example, they will show average mortality risks for people consuming 1, 2, 3 etc. drinks per day. These studies suggest that there is a J-curve relationship between alcohol consumption and health (). That is, drinking a little is better than not drinking; and drinking a lot is worse than drinking a little.

However, using “rough” ranges of 1, 2, 3 etc. drinks per day prevents those studies from getting to a more fine-grained picture of the beneficial effects of alcohol consumption.

Contrary to popular belief, the positive health effects of moderate alcohol consumption have little, if anything, to do with polyphenols such as resveratrol. Resveratrol, once believed to be the fountain of youth, is found in the skin of red grapes.

It is in fact the alcohol content that has positive effects, apparently reducing the incidence of coronary heart disease, diabetes, hypertension, congestive heart failure, stroke, dementia, Raynaud’s phenomenon, and all-cause mortality. Raynaud's phenomenon is associated with poor circulation in the extremities (e.g., toes, fingers), which in some cases can progress to gangrene.

In most studies of the effects of alcohol consumption on health, the J-curves emerge from visual inspection of the plots of averages across ranges of consumption. Rarely you find studies where nonlinear relationships are “discovered” by software tools such as WarpPLS (), with effects being adjusted according.

You do find, however, some studies that fit reasonably justified functions to the data. Di Castelnuovo and colleagues’ study, published in JAMA Internal Medicine in 2006 (), is probably the most widely cited among these studies. This study is a meta-analysis; i.e., a study that builds on various other empirical studies.

I think that the journal in which this study appeared was formerly known as Archives of Internal Medicine, a fairly selective and prestigious journal, even though this did not seem to be reflected in its Wikipedia article at the time of this writing ().

What Di Castelnuovo and colleagues found is interesting. They fitted a bunch of nonlinear functions to the data, all with J-curve shapes. The results suggest a lot of variation in the maximum amount one can drink before mortality becomes higher than not drinking at all; that maximum amount ranges from about 4 to 6 drinks per day.

But there is little variation in one respect. The optimal amount of alcohol is somewhere around 5 and 7 g/d, which translates into about the following every day: half a can of beer, half a glass of wine, or half a “shot” of spirit. This is clearly a common trait of all of the nonlinear functions that they generated. This is illustrated in the figure below, from the article.


As you can seen from the curves above, a little bit of alcohol every day seems to have an acute effect on mortality reduction. And it seems that taking little doses every day is much better than taking the equivalent dose over a larger period of time; for instance, the equivalent per week, taken once a week. This is suggested by other studies as well ().

The curves above do not clearly reflect a couple of problems with alcohol consumption. One is that alcohol seems to be treated by the body as a toxin, which causes some harm and some good at the same time, the good being often ascribed to hormesis (). Someone who is more sensitive to alcohol’s harmful effects, on the liver for example, may not benefit as much from its positive effects.

The curves are averages that pass through points, after which the points are forgotten; even though they are real people.

The other problem with alcohol is that most people who are introduced to it in highly urbanized areas (where most people live) tend to drink it because of its mood-altering effects. This leads to a major danger of addiction and abuse. And drinking a lot of alcohol is much worse than not drinking at all.

Interestingly, in traditional Mediterranean Cultures where wine is consumed regularly, people tend to generally frown upon drunkenness ().

Senin, 17 Oktober 2011

Book review: Perfect Health Diet

Perfect Health Diet is a book that one should own. It is not the type of book that you can get from your local library and just do a quick read over (and, maybe, write a review about it). If you do that, you will probably miss several important ideas that form the foundation of this book, which is a deep foundation.

The book is titled “Perfect Health Diet”, not “The Perfect Health Diet”. If you think that this is a mistake, consider that the most successful social networking web site of all time started as “The Facebook”, and then changed to simply “Facebook”; which was perceived later as a major improvement.

Moreover, “Perfect Health Diet” makes for a cool and not at all inappropriate acronym – “PHD”.

What people eat has an enormous influence on their lives, and also on the lives of those around them. Nutrition is clearly one of the most important topics in the modern world - it is the source of much happiness and suffering for entire populations. If Albert Einstein and Marie Curie were alive today, they would probably be interested in nutrition, as they were about important topics of their time that were outside their main disciplines and research areas (e.g., the consequences of war, and future war deterrence).

Nutrition attracts the interest of many bright people today. Those who are not professional nutrition researchers often fund their own research, spending hours and hours of their own time studying the literature and even experimenting on themselves. Several of them decide to think deeply and carefully about it. A few, like Paul Jaminet and Shou-Ching Jaminet, decide to write about it, and all of us benefit from their effort.

The Jaminets have PhDs (not copies of their books, degrees). Their main PhD disciplines are somewhat similar to Einstein’s and Curie’s; which is an interesting coincidence. What the Jaminets have written about nutrition is probably analogous, in broad terms, to what Einstein and Curie would have written about nutrition if they were alive today. They would have written about a “unified field theory” of nutrition, informed by chemistry.

To put it simply, the main idea behind this book is to find the “sweet spot” for each major macronutrient (e.g., protein and fat) and micronutrient (e.g., vitamins and minerals) that is important for humans. The sweet spot is the area indicated on the graph below. This is my own simplified interpretation of the authors' more complex graphs on marginal benefits from nutrients.


The book provides detailed information about each of the major nutrients that are important to humans, what their “sweet spot” levels are, and how to obtain them. In this respect the book is very thorough, and also very clear, including plenty of good arguments and empirical research results to back up the recommendations. But this book is much more than that.

Why do I refer to this book as proposing a “unified field theory” of nutrition? The reason is that this book clearly aims at unifying all of the current state of the art knowledge about nutrition, departing from a few fundamental ideas.

One of those fundamental ideas is that a good diet would provide nutrients in the same ratio as those provided by our own tissues when we “cannibalize” them – i.e., when we fast. Another is that human breast milk is a good basis for the estimation of the ratios of macronutrients a human adult would need for optimal health.

And here is where the depth and brilliance with which the authors address these issues can lead to misunderstandings.

For example, when our body “cannibalizes” itself (e.g., at the 16-h mark of a water fast), there is no digestion going on. And, as the authors point out, what you eat, in terms of nutrients, is often not what you get after digestion. It may surprise many to know that a diet rich in vegetables is actually a high fat diet (if you are surprised, you should read the book). One needs to keep these things in mind to understand that not all dietary macronutrient ratios will lead to the same ratios of nutrients after digestion, and that the dietary equivalent of “cannibalizing” oneself is not a beef-only diet.

Another example relates to the issue of human breast milk. Many seem to have misunderstood the authors as implying that the macronutrient ratios in human breast milk are optimal for adult humans. The authors say nothing of the kind. What they do is to use human breast milk as a basis for their estimation of what an adult human should get, based on a few reasonable assumptions. One of the assumptions is that a human adult’s brain consumes proportionally much less sugar than an infant’s.

Yet another example is the idea of “safe starches”, which many seem to have taken as a recommendation that diabetics should eat lots of white rice and potato. The authors have never said such a thing in the book; not even close. "Safe starches", like white rice and sweet potatoes (as well as white potatoes), are presented in the book as good sources of carbohydrates that are also generally free from harmful plant toxins. And they are, if consumed after cooking.

By the way, I have a colleague who has type 2 diabetes and can eat meat with white potatoes without experiencing hyperglycemia, as long as the amount of potato is very small and is eaten after a few bites of meat.

Do I disagree with some of the things that the authors say? Sure I do, but not in a way that would lead to significantly different dietary recommendations. And, who knows, maybe I am wrong.

For example, the authors seem to think that dietary advanced glycation end-products (AGEs) can be a problem for humans, and therefore recommend that you avoid cooking meat at high temperatures (no barbecuing, for example). I have not found any convincing evidence that this is true in healthy people, but following the authors’ advice will not hurt you at all. And if your digestive tract is compromised to the point that undigested food particles are entering your bloodstream, then maybe you should avoid dietary sources of AGEs.

Also, I think that humans tend to adapt to different macronutrient ratios in more fundamental ways than the authors seem to believe they can. These adaptations are long-term ones, and are better understood based on the notion of compensatory adaptation. For instance, a very low carbohydrate diet may bring about some problems in the short term, but long-term adaptations may reverse those problems, without a change in the diet.

The authors should be careful about small errors that may give a bad impression to some experts, and open them up to undue criticism; as experts tend to be very picky and frequently generalize based on small errors. Here is one. The authors seem to imply that eating coconut oil will help feed colon cells, which indeed seem to feed on short-chain fats; not exactly the medium-chain fats abundantly found in coconut oil, but okay. (This may be the main reason why indigestible fiber contributes to colon health, by being converted by bacteria to short-chain fats.) The main problem with the authors' implied claim is that coconut oil, as a fat, will be absorbed in the small intestine, and thus will not reach colon cells in any significant amounts.

Finally, I don’t think that increased animal protein consumption causes decreased longevity; an idea that the authors seem to lean toward. One reason is that seafood consumption is almost universally associated with increased longevity, even when it is heavily consumed, and seafood in general has a very high protein-to-fat ratio (much higher than beef). The connection between high animal protein consumption and decreased longevity suggested by many studies, some of which are cited in the book, is unlikely to be due to the protein itself, in my opinion. That connection is more likely to be due to some patterns that may be associated in certain populations with animal protein consumption (e.g., refined wheat and industrial seed oils consumption).

Thankfully, controversial issues and small errors can be easily addressed online. The authors maintain a popular blog, and they do so in such a way that the blog is truly an extension of the book. This blog is one of my favorites. Perhaps we will see some of the above issues addressed in the blog.

All in all, this seems like a bargain to me. For about 25 bucks (less than that, if you trade in quid; and more, if you do in Yuan), and with some self-determination, you may save thousands of dollars in medical bills. More importantly, you may change your life, and those of the ones around you, for the better.

Senin, 12 September 2011

Fasting blood glucose of 83 mg/dl and heart disease: Fact and fiction

If you are interested in the connection between blood glucose control and heart disease, you have probably done your homework. This is a scary connection, and sometimes the information on the Internetz make people even more scared. You have probably seen something to this effect mentioned:
Heart disease risk increases in a linear fashion as fasting blood glucose rises beyond 83 mg/dl.
In fact, I have seen this many times, including on some very respectable blogs. I suspect it started with one blogger, and then got repeated over and over again by others; sometimes things become “true” through repetition. Frequently the reference cited is a study by Brunner and colleagues, published in Diabetes Care in 2006. I doubt very much the bloggers in question actually read this article. Sometimes a study by Coutinho and colleagues is also cited, but this latter study is actually a meta-analysis.

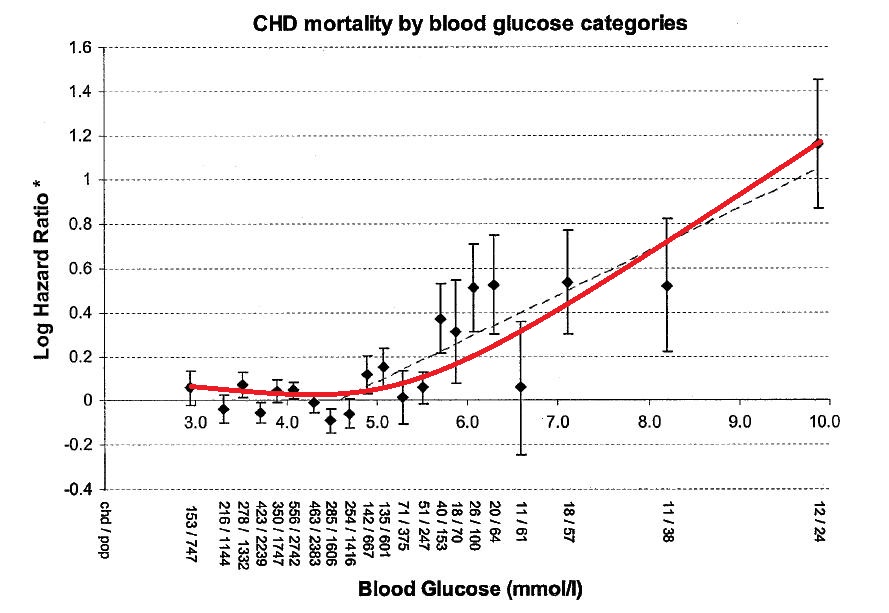
So I decided to take a look at the Brunner and colleagues study. It covers, among other things, the relationship between cardiovascular disease (they use the acronym CHD for this), and 2-hour blood glucose levels after a 50-g oral glucose tolerance test (OGTT). They tested thousands of men at one point in time, and then followed them for over 30 years, which is really impressive. The graph below shows the relationship between CHD and blood glucose in mmol/l. Here is a calculator to convert the values to mg/dl.


The authors note in the limitations section that: “Fasting glucose was not measured.” So these results have nothing to do with fasting glucose, as we are led to believe when we see this study cited on the web. Also, on the abstract, the authors say that there is “no evidence of nonlinearity”, but in the results section they say that the data provides “evidence of a nonlinear relationship”. The relationship sure looks nonlinear to me. I tried to approximate it manually below.


Note that CHD mortality really goes up more clearly after a glucose level of 5.5 mmol/l (100 mg/dl). But it also varies significantly more widely after that level; the magnitudes of the error bars reflect that. Also, you can see that at around 6.7 mmol/l (121 mg/dl), CHD mortality is on average about the same as at 5.5 mmol/l (100 mg/dl) and 3.5 mmol/l (63 mg/dl). This last level suggests an abnormally high insulin response, bringing blood glucose levels down too much at the 2-hour mark – i.e., reactive hypoglycemia, which the study completely ignores.

These findings are consistent with the somewhat chaotic nature of blood glucose variations in normoglycemic individuals, and also with evidence suggesting that average blood glucose levels go up with age in a J-curve fashion even in long-lived individuals.

We also know that traits vary along a bell curve for any population of individuals. Research results are often reported as averages, but the average individual does not exist. The average individual is an abstraction, and you are not it. Glucose metabolism is a complex trait, which is influenced by many factors. This is why there is so much variation in mortality for different glucose levels, as indicated by the magnitudes of the error bars.

In any event, these findings are clearly inconsistent with the statement that "heart disease risk increases in a linear fashion as fasting blood glucose rises beyond 83 mg/dl". The authors even state early in the article that another study based on the same dataset, to which theirs was a follow-up, suggested that:
…. [CHD was associated with levels above] a postload glucose of 5.3 mmol/l [95 mg/dl], but below this level the degree of glycemia was not associated with coronary risk.
Now, exaggerating the facts, to the point of creating fictitious results, may have a positive effect. It may scare people enough that they will actually check their blood glucose levels. Perhaps people will remove certain foods like doughnuts and jelly beans from their diets, or at least reduce their consumption dramatically. However, many people may find themselves with higher fasting blood glucose levels, even after removing those foods from their diets, as their bodies try to adapt to lower circulating insulin levels. Some may see higher levels for doing other things that are likely to improve their health in the long term. Others may see higher levels as they get older.

Many of the complications from diabetes, including heart disease, stem from poor glucose control. But it seems increasingly clear that blood glucose control does not have to be perfect to keep those complications at bay. For most people, blood glucose levels can be maintained within a certain range with the proper diet and lifestyle. You may be looking at a long life if you catch the problem early, even if your blood glucose is not always at 83 mg/dl (4.6 mmol/l). More on this on my next post.

Senin, 05 September 2011

Nonlinearity and the industrial seed oils paradox

Most relationships among variables in nature are nonlinear, frequently taking the form of a J curve. The figure below illustrates this type of curve. In this illustration, the horizontal axis measures the amount of time an individual spends consuming a given dose (high) of a substance daily. The vertical axis measures a certain disease marker – e.g., a marker of systemic inflammation, such as levels of circulating tumor necrosis factor (TNF). This is just one of many measurement schemes that may lead to a J curve.


J-curve relationships and variants such as U-curve and inverted J-curve relationships are ubiquitous, and may occur due to many reasons. For example, a J curve like the one above may be due to the substance being consumed having at least one health-promoting attribute, and at least one health-impairing attribute. The latter has a delayed effect, and ends up overcoming the benefits of the former over time. In this sense, there is no “sweet spot”. People are better off not consuming the substance at all. They should look for other sources of the health-promoting factors.

So what does this have to do with industrial seed oils, like safflower and corn oil?

If you take a look at the research literature on the effects of industrial seed oils, you’ll find something interesting and rather paradoxical. Several studies show benefits, whereas several others hint at serious problems. The problems seem to be generally related to long-term consumption, and to be associated with a significant increase in the ratio of dietary omega-6 to omega-3 fats; this increase appears to lead to systemic inflammation. The benefits seem to be generally related to short-term consumption.

But what leads to the left side of the J curve, the health-promoting effects of industrial seed oils, usually seen in short-term studies?

It is very likely vitamin E, which is considered, apparently correctly, to be one of the most powerful antioxidants in nature. Oxidative stress is strongly associated with systemic inflammation. Seed oils are by far the richest sources of vitamin E around, in the form of both γ-Tocopherol and α-Tocopherol. Other good sources, with much less gram-adjusted omega-6 content, are what we generally refer to as “nuts”. And, there are many, many substances other than vitamin E that have powerful antioxidant properties.

Chris Masterjohn has talked about seed oils and vitamin E before, making a similar point (see here, and here). I acknowledged this contribution by Chris before; for example, in my June 2011 interview with Jimmy Moore. In fact, Chris has gone further and also argued that the vitamin E requirement goes up as body fat omega-6 content increases over time (see comments under this post, in addition to the links provided above).

If this is correct, I would speculate that it may create a vicious feedback-loop cycle, as the increased vitamin E requirement may lead to increased hunger for foods rich in vitamin E. For someone already consuming a diet rich in seed oils, this may drive a subconscious compulsion to add more seed oils to dishes. Not good!