Tampilkan postingan dengan label cardiovascular disease. Tampilkan semua postingan

Senin, 27 Juli 2015

The PCSK9 enzyme, LDL cholesterol, and cardiovascular diseases


Cardiovascular diseases are currently the leading cause of death in most developed countries. They are particularly common among seniors; i.e., those aged 65 and older. Part of the reason for this is that infectious diseases do not kill as many people as they used to.

Given the trend toward population aging, with seniors making up an increasingly larger percentage of the population, the market for drugs against cardiovascular diseases is growing. A new class of such drugs is making the news lately; they target the PCSK9 enzyme ().

Enzymes are (usually) proteins that speed up chemical reactions, and are needed in virtually all metabolic processes that occur in cells. Proprotein convertase subtilisin/kexin type 9 (PCSK9) is an enzyme that degrades LDL cholesterol receptors on the surface of liver cells. Fewer LDL cholesterol receptors mean reduced uptake of the particles that carry LDL cholesterol, and thus more LDL particles in circulation. This may be problematic if these are small-dense LDL particles ().

Small-dense LDL particles include particles that are significantly smaller than the gaps in the endothelium (). The endothelium is a thin layer of cells that line the interior of arteries. Those gaps are about 25-26 nanometers (nm) in diameter. Small-dense LDL particles can contribute a lot more to the formation of atheromas (atherosclerotic plaques) in predisposed individuals than large-buoyant LDL particles.

There is evidence of the natural occurrence of low LDL cholesterol in individuals of African descent due to genetic mutations influencing PCSK9 levels (). This leads us to a very important question. By reducing PCSK9 in circulation, can we also reduce the incidence of cardiovascular disease?

The answer to this question depends on whether LDL cholesterol is a causative factor in cardiovascular disease. If it is, then reducing PCSK9 in circulation can indeed reduce the incidence of cardiovascular disease. The problem is that, most of the evidence so far suggests that LDL cholesterol is NOT a causative factor in cardiovascular disease.

Yes, there are studies that show that LDL cholesterol is correlated with cardiovascular disease, but the problem is that LDL cholesterol is a marker of other factors that are better candidates for causes of cardiovascular disease – hence the correlation. For example, LDL cholesterol goes up with mental stress (), and chronic mental stress seems to be a good candidate for a cause of cardiovascular disease.

LDL cholesterol is also a marker of a diet with more saturated fat in it (). In many contexts, a diet with more saturated fat in it is a more nutritious diet, which leads to a negative association between LDL cholesterol and mortality.

The graph below shows the shape of the association between total cholesterol (TOTCHOL) and mortality from all cardiovascular diseases (MVASC), based on an analysis of the China Study II dataset (). LDL cholesterol is the main component of total cholesterol in most people. The values are provided in standardized format; e.g., 0 is the average, 1 is one standard deviation above the mean, and so on. The best-fitting curve was obtained with the software WarpPLS ().

In fact, when we combine the totality of the evidence linking LDL cholesterol and cardiovascular diseases, LDL cholesterol seems to come out as a marker of protective factors. A reflection of this is a widely cited study by Weverling-Rijnsburger and colleagues, of LDL and HDL cholesterol as factors in cardiovascular diseases among people aged 85 and older (). The conclusions of the study were that:

- There was no association between LDL cholesterol level and risk of fatal cardiovascular disease.

- A low HDL cholesterol level was associated with a two-fold higher risk of fatal cardiovascular disease.

- Both low LDL cholesterol and low HDL cholesterol levels were associated with an increased mortality risk from infections.

The results above are particularly interesting because the study participants, given their ages, were at a high risk of mortality from cardiovascular diseases. It seems that the best scenario for these folks would have been a concomitant increase in both LDL and HDL cholesterol levels, which seems to be exactly what happens when one increases his or her intake of foods rich in saturated fat and dietary cholesterol ()!

Should you take a drug that targets the PCSK9 enzyme, to reduce your LDL cholesterol? Maybe you should ask Peter ().

Senin, 29 Juni 2015

Ischemic heart disease among Greenland Inuit: Data from 1962 to 1964

The traditional Inuit diet is very high in animal protein and fat. It also includes plant matter. Typically it is made up primarily of the following: fish, walrus, seal, whale, berries, and fireweed (of which syrups and jellies can be made).

Kjærgaard and colleagues (see under References, at the end of this post) examined data from an Inuit population in Greenland from 1962 to 1964, prior to the heavy westernization of their diet that is seen today. They investigated 96.9% of the whole population in three areas, including Ammassalik in East Greenland (n = 1,851).

Of those, only 181 adults, or 9.7 percent, had anything that looked like an abnormality that could suggest ischemia. This included ventricular hypertrophy (an enlargement of the heart chambers), leading to an overestimation because benign ventricular hypertrophy is induced by continuous physical exertion. These 181 adults were then selected for further screening.

Benign ventricular hypertrophy is also known as athlete's heart, because it is common among athletes. A prevalence of ventricular hypertrophy at a relatively young age, and declining with age, would suggest benign hypertrophy. The opposite would suggest pathological hypertrophy, which is normally induced by chronic hypertension.

As you can see from the figure below, from Kjærgaard et al. (2009), the pattern observed among the Inuit was of benign hypertrophy, suggestive of strong physical exertion at a young age.


A pattern of benign hypertrophy induced by robust physical activity is also consistent with reports by Stefansson (1958) about the life of the Eskimos in Northern Alaska. It is reasonable to assume that these Eskimos had a diet and lifestyle similar to the Greenland Inuit.

Back to Kjærgaard et al.’s (2009) study. The 181 adults selected for further screening then had a 12-lead ECG performed (this is a widely used test to check for heart abnormalities). The results suggested that only two men, aged 62 and 63 years, had ischemic heart disease. All in all, this suggests a prevalence of ischemic heart disease of 0.11 percent, which is very low.

(The authors of the article estimated the prevalence of ischemic heart disease at 1.1 percent, because they used the n = 181, as opposed to the original n = 1,851, in their calculation. The latter is the correct baseline sample size, in my opinion. Still, the authors present the 1.1 percent number as quite low as well, which it is.)

The prevalence of ischemic heart disease in the US of approximately 6.8 percent. That is, the prevalence in the US is 63 times higher than among the Inuit studied (using the 0.11 percent as the basis for comparison). And, it should be noted that there are many countries with a higher prevalence of ischemic heart disease than modern US.

It is possible that the low prevalence of ischemic heart disease among the Inuit was partly due to a higher mortality of those with the disease than in modern US, where medical intervention can prolong one's life in the presence of almost any disease. That is, perhaps many of those Inuit with ischemia would die quickly, and thus would not be captured by a study like this.

It is doubtful, however, that this would explain a difference as large as the one observed. Moreover, if many Inuit were dying due to ischemia, there would probably be plenty of evidence suggesting that. (I would imagine that the mysterious deaths associated with chest pain, and other related symptoms, would be a constant topic of conversation.) Reports from early explorers, however, suggest the opposite (e.g., Stefansson, 1958), and are consistent with the study described here.

In conclusion, this study suggests that the diet and lifestyle of the Greenland Inuit prior to the 1960’s (i.e., not their traditional diet and lifestyle, but approaching it) could be seen today as heart-healthy (at least for them), even though the Greenland Inuit ate a lot of animal protein and fat.

References:

Kjærgaard, M., Andersen, S., Holten, M., Mulvad, G., Kjærgaard, J.J. (2009). Low occurrence of ischemic heart disease among Inuit around 1963 suggested from ECG among 1851 East Greenland Inuit. Atherosclerosis, 203(2), 599-603.

Stefansson, V. (1958). Eskimo longevity in Northern Alaska. Science, 127(3288), 16-19.

Rabu, 27 Mei 2015

Large LDL and small HDL particles: The best combination

High-density lipoprotein (HDL) is one of the five main types of lipoproteins found in circulation, together with very low-density lipoprotein (VLDL), intermediate-density lipoprotein (IDL), low-density lipoprotein (LDL), and chylomicrons.

After a fatty meal, the blood is filled with chylomicrons, which carry triglycerides (TGAs). The TGAs are transferred to cells from chylomicrons via the activity of enzymes, in the form of free fatty acids (FFAs), which are used by those cells as sources of energy.

After delivering FFAs to the cells, the chylomicrons progressively lose their TGA content and “shrink”, eventually being absorbed and recycled by the liver. The liver exports part of the TGAs that it gets from chylomicrons back to cells for use as energy as well, now in the form of VLDL. As VLDL particles deliver TGAs to the cells they shrink in size, similarly to chylomicrons. As they shrink, VLDL particles first become IDL and then LDL particles.

The figure below (click on it to enlarge), from Elliott & Elliott (2009; reference at the end of this post), shows, on the same scale: (a) VLDL particles, (b) chylomicrons, (c) LDL particles, and (d) HDL particles. The dark bar at the bottom of each shot is 1000 A in length, or 100 nm (A = angstrom; nm = nanometer; 1 nm = 10 A).


As you can see from the figure, most of the LDL particles shown are about 1/4 of the length of the dark bar in diameter, often slightly more, or about 25-27 nm in size. They come in different sizes, with sizes in this range  being the most common. The smaller and denser they are, the more likely they are to contribute to the formation of atherosclerotic plaque in the presence of other factors, such as chronic inflammation. The larger they become, which usually happens in diets high in saturated fat, the less likely they are to form plaque.

Note that the HDL particles are rather small compared to the LDL particles. Shouldn’t they cause plaque then? Not really. Apparently they have to be small, compared to LDL particles, to do their job effectively.

HDL is a completely different animal from VLDL, IDL and LDL. HDL particles are produced by the liver as dense disk-like particles, known as nascent HDL particles. These nascent HDL particles progressively pick up cholesterol from cells, as well as performing a number of other functions, and “fatten up” with cholesterol in the process.

This process also involves HDL particles picking up cholesterol from plaque in the artery walls, which is one of the reasons why HDL cholesterol is informally called “good” cholesterol. In fact, neither HDL nor LDL are really cholesterol; HDL and LDL are particles that carry cholesterol, protein and fat.

As far as particle size is concerned, LDL and HDL are opposites. Large LDL particles are the least likely to cause plaque formation, because LDL particles have to be approximately 25 nm in diameter or smaller to penetrate the artery walls. With HDL the opposite seems to be true, as HDL particles need to be small (compared with LDL particles) to easily penetrate the artery walls in order to pick up cholesterol, leave the artery walls with their cargo, and have it returned back to the liver.

Interestingly, some research suggests HDL particles that are larger in size, when compared with other HDL particles (not with LDL particles), seem to do a better job than very small HDL particles in terms of reducing risk of cardiovascular disease. It is also possible that a high number of larger HDL particles in the blood is indicative of elevated levels of "effective" HDL particles; i.e., particles that are effective at picking up cholesterol from the artery walls in the first place.

Another interesting aspect of this cycle is that the return to the liver of cholesterol picked up by HDL appears to be done largely via IDL and LDL particles (Elliott & Elliott, 2009), which get the cholesterol directly from HDL particles! Life is not that simple.

Reference:

William H. Elliott & Daphne C. Elliott (2009). Biochemistry and Molecular Biology. 4th Edition. New York: NY: Oxford University Press.

Senin, 28 Juli 2014

What is “relative risk” (RR)? The case of alcohol frequency and its impact on mortality from stroke


This post is in response to an inquiry by Ivor (sorry for the delayed response). It refers to a recent study by Rantakömi and colleagues on the effect of alcohol consumption frequency on mortality from stroke (). The study followed men who consumed alcohol to different degrees, including no consumption at all, over a period of a little more than 20 years.

The study purportedly controlled for systolic blood pressure, smoking, body mass index, diabetes, socioeconomic status, and total amount of alcohol consumption. That is, its results are presented as holding regardless of those factors.

The main results were reported in terms of “relative risk” (RR) ratios. Here they are, quoted from the abstract:

“0.71 (95% CI, 0.30–1.68; P = 0.437) for men with alcohol consumption <0.5 times per week and 1.16 (95% CI, 0.54–2.50; P = 0.704) among men who consumed alcohol 0.5–2.5 times per week. Among men who consumed alcohol >2.5 times per week compared with nondrinkers, RR was 3.03 (95% CI, 1.19–7.72; P = 0.020).”

Note the P values reported within parentheses. They are the probabilities that the results are due to chance and thus “not real”, or not due to actual effects. By convention, P values equal to or lower than 0.05 are considered statistically significant. In consequence, P values greater than 0.05 are seen as referring to effects that cannot be unequivocally considered real.

This means that, of the results reported, only one seems to be due to a real effect, and that is the one that: “Among men who consumed alcohol >2.5 times per week compared with nondrinkers, RR was 3.03 …”

Why the authors report the statistically non-significant results as if they were noteworthy is unclear to me.

Before we go any further, let us look at what “relative risk” (RR) means. RR is given by the following ratio:

(Probability of an event when exposed) / (Probability of an event when not exposed)

In the study by Rantakömi and colleagues, the event is death from stroke. The exposure refers to alcohol consumption at a certain level, compared to no alcohol consumption (no exposure).

Now, let us go back to the result regarding consumption of alcohol more than 2.5 times per week. That result sounds ominous. It is helpful to keep in mind that the study by Rantakömi and colleagues followed a total of 2609 men with no history of stroke, of whom only 66 died from stroke.

Consider the following scenario. Let us say that 1 person in a group of 1,000 people who consumed no alcohol died from stroke. Let us also say that 3 people in a group of 1,000 people who consumed alcohol more than 2.5 times per week died from stroke. Given this, the RR would be: (3/1,000) / (1/1,000) = 3.

One could say, based on this, that: “Consuming alcohol more than 2.5 times per week increases the risk of dying from stroke by 200%”. Based on the RR, this is technically correct. It is rather misleading nevertheless.

If you think that increasing sample size may help ameliorate the problem, think again. The RR would be the same if it was 3 people versus 1 person in 1,000,000 (one million). With these numbers, the RR would be even less credible, in my view.

This makes the findings by Rantakömi and colleagues look a lot less ominous, don’t you think? This post is not really about the study by Rantakömi and colleagues. It is about the following question, which is in the title of this post: What is “relative risk” (RR)?

Quite frankly, given what one sees in RR-based studies, the answer is arguably not far from this:

RR is a ratio used in statistical analysis that makes minute effects look enormous; the effects in question would not normally be noticed by anyone in real life, and may be due to chance after all.

The reason I say that the effects “may be due to chance after all” is that when effects are such that 1 event in 1,000 would make a big difference, a researcher would have to control for practically everything in order to rule out confounders.

If one single individual with a genetic predisposition toward death from stroke falls into the group that consumes more alcohol, falling in that group entirely by chance (or due to group allocation bias), the RR-based results would be seriously distorted.

This highlights one main problem with epidemiological studies in general, where RR is a favorite ratio to be reported. The problem is that epidemiological studies in general refer to effects that are tiny.

One way to put results in context and present them more “honestly” would be to provide more information to readers, such as graphs showing data points and unstandardized scales, like the one below. This graph is from a previous post on latitude and cancer rates in the USA (), and has been generated with the software WarpPLS ().


This graph clearly shows that, while there seems to be an association between latitude and cancer rates in the USA, the total variation in cancer rates in the sample is only of around 3 in 1,000. This graph also shows outliers (e.g., Alaska), which call for additional explanations.

As for the issue of alcohol consumption frequency and mortality, I leave you with the results of a 2008 study by Breslow and Graubard, with more citations and published in a more targeted journal ():

“Average volume obscured effects of quantity alone and frequency alone, particularly for cardiovascular disease in men where quantity and frequency trended in opposite directions.”

In other words, alcohol consumption in terms of volume (quantity multiplied by frequency) appears to matter much more than quantity or frequency alone. We can state this even more simply: drinking two bottles of whiskey in one sitting, but only once every two weeks, is not going to be good for you.

In the end, providing more information to readers so that they can place the results in context is a matter of scientific honesty.

Senin, 24 Desember 2012

The 2012 Atherosclerosis egg study: More smoking is associated with more plaque, unless you eat more eggs

I blogged before about the study by David Spence and colleagues, published online in July 2012 in the journal Atherosclerosis (). This study attracted a lot of media attention (e.g., ). The article is titled: “Egg yolk consumption and carotid plaque”. The study argues that “regular consumption of egg yolk should be avoided by persons at risk of cardiovascular disease”. It hints at egg yolks being unhealthy in general, possibly even more so than cigarettes.

I used the numbers in Table 2 of the article (only 5 rows of data, one per quintile; i.e., N=5) to conduct a type of analysis that is rarely if ever conducted in health studies – a moderating effects analysis. A previous blog post summarizes the results of one such analysis using WarpPLS (). It looked into the effect of the number of eggs consumed per week on the association between blood LDL cholesterol and plaque (carotid plaque). The conclusion, which is admittedly tentative due to the small sample (N=5), was that plaque decreased as LDL cholesterol increased with consumption of 2.3 eggs per week or more ().

Recently I ran an analysis on the moderating effect of number of eggs consumed per week on the association between cumulative smoking (measured in “pack years”) and plaque. As it turns out, if you fit a 3D surface to the five data points that you get for these three variables from Table 2 of the article, you end up with a relatively smooth surface. Below is a 3D plot of the 5 data points, followed by a best-fitting 3D surface (developed using an experimental algorithm).


Based on this best-fitting surface you could then generate a contour graph, shown below. The “lines” are called “isolines”. Each isoline refers to plaque values that are constant for a set of eggs per week and cumulative smoking combinations. Next to the isolines are the corresponding plaque values. The first impression is indeed that both egg consumption and smoking are causing plaque buildup, as plaque clearly increases as one moves toward the top-right corner of the graph.


But focus your attention on each individual isoline, one at a time. It is clear that plaque remains constant for increases in cumulative smoking, as long as egg consumption increases. Take for example the isoline that refers to 120 mm2 of plaque area. An increase in cumulative smoking from about 14.5 to 16 pack years leads to no increase in plaque if egg consumption goes up from about 2 to 2.3 eggs per week.

These within-isoline trends, which are fairly stable across isolines (they are all slanted to the right), clearly contradict the idea that eggs cause plaque buildup. So, why does plaque buildup seem to clearly increase with egg consumption? Here is a good reason: egg consumption is very strongly correlated with age, and plaque increases with age. The correlation is a whopping 0.916. And I am not talking about cumulative egg consumption, which the authors also measure, through a variable called “egg-yolk years”. No, I am talking about eggs per week. In this dataset, older folks were eating more eggs, period.

The correlation between plaque and age is even higher: 0.977. Given this, it makes sense to look at individual isolines. This would be analogous to what biostatisticians often call “adjusting for age”, or analyzing the effect of egg consumption on plaque buildup “keeping age constant”. A different technique is to “control for age”; this technique would be preferable had the correlations been lower (say, lower than 0.7), as collinearity levels might have been below acceptable thresholds.

The underlying logic of the “keeping age constant” technique is fairly sound in the face of such a high correlation, which would make “controlling for age” very difficult due to collinearity. When we “keep age constant”, the results point at egg consumption being protective among smokers.

But diehard fans of the idea that eggs are unhealthy could explain the results differently. Maybe egg consumption causes plaque to go up, but smoking has a protective effect. Again taking the isoline that refers to 120 mm2 of plaque area, these diehard fans could say that an increase in egg consumption from 2 to 2.3 eggs per week leads to no increase in plaque if cumulative smoking goes up from about 14.5 to 16 pack years.

Not too long ago I also blogged about a medical case study of a man who ate approximately 25 eggs (20 to 30) per day for over 15 years (probably well over), was almost 90 years old (88) when the case was published in the prestigious The New England Journal of Medicine, and was in surprisingly good health (). This man was not a smoker.

Perhaps if this man smoked 25 cigarettes per day, and ate no eggs, he would be in even better health eh!?

Senin, 01 Oktober 2012

The anatomy of a VAP test report

The vertical auto profile (VAP) test is an enhanced lipid profile test. It has been proposed, chiefly by the company Atherotech (), as a more complete test that relies on direct measurement of previously calculated lipid measures. The VAP test is particularly known for providing direct measurements of LDL cholesterol, instead of calculating them through equations ().

At the time of this writing, a typical VAP test report would provide direct measures of the cholesterol content of LDL, Lp(a), IDL, HDL, and VLDL particles. It would also provide additional measures referred to as secondary risk factors, notably particle density patterns and apolipoprotein concentrations. Finally, it would provide a customized risk summary and some basic recommendations for treatment. Below is the top part of a typical VAP test report (from Atherotech), showing measures of the cholesterol content of various particles. LDL cholesterol is combined for four particle subtypes, the small-dense subtypes 4 and 3, and the large-buoyant subtypes 2 and 1. A breakdown by LDL particle subtype is provided later in the VAP report.


In the table above, HDL cholesterol is categorized in two subtypes, the small-dense subtype 2, and the large-buoyant subtype 3. Interestingly, most of the HDL cholesterol in the table is supposedly of the least protective subtype, which seems to be a common finding in the general population. VLDL cholesterol is categorized in a similar way. IDL stands for intermediate-density lipoprotein; this is essentially a VLDL particle that has given off some of its content, particularly its triglyceride (or fat) cargo, but still remains in circulation.

Lp(a) is a special subtype of the LDL particle that is purported to be associated with markedly atherogenic factors. Mainstream medicine generally considers Lp(a) particles themselves to be atherogenic, which is highly debatable. Among other things, cardiovascular disease (CVD) risk and Lp(a) concentration follow a J-curve pattern, and Lp(a)’s range of variation in humans is very large. A blog post by Peter (Hyperlipid) has a figure right at the top that illustrates the former J-curve assertion (). The latter fact, related to range of variation, generally leads to a rather wide normal distribution of Lp(a) concentrations in most populations; meaning that a large number of individuals tend to fall outside Lp(a)’s optimal range and still have a low risk of developing CVD.

Below is the middle part of a typical VAP report, showing secondary risk factors, such as particle density patterns and apolipoprotein concentrations. LDL particle pattern A is considered to be the most protective, supposedly because large-buoyant LDL particles are less likely to penetrate the endothelial gaps, which are about 25 nm in diameter. Apolipoproteins are proteins that bind to fats for their transport in lipoproteins, to be used by various tissues for energy; free fatty acids also need to bind to proteins, notably albumin, to be transported to tissues for use as energy. Redundant particles and processes are everywhere in the human body!


Below is the bottom part of a typical VAP report, providing a risk summary and some basic recommendations. One of the recommendations is “to lower” the LDL target from 130mg/dL to 100mg/dL due to the presence of the checked emerging risk factors on the right, under “Considerations”. What that usually means in practice is a recommendation to take drugs, especially statins, to reduce LDL cholesterol levels. A recent post here and the discussion under it suggest that this would be a highly questionable recommendation in the vast majority of cases ().


What do I think about VAP tests? I think that they are useful in that they provide a lot more information about one’s lipids than standard lipid profiles, and more information is better than less. On the other hand, I think that people should be very careful about what they do with that information. There are even more direct tests that I would recommend before a decision to take drugs is made (, ), if that decision is ever made at all.

Senin, 28 November 2011

Triglycerides, VLDL, and industrial carbohydrate-rich foods

Below are the coefficients of association calculated by HealthCorrelator for Excel (HCE) for user John Doe. The coefficients of association are calculated as linear correlations in HCE (). The focus here is on the associations between fasting triglycerides and various other variables. Take a look at the coefficient of association at the top, with VLDL cholesterol, indicated with a red arrow. It is a very high 0.999.


Whoa! What is this – 0.999! Is John Doe a unique case? No, this strong association between fasting triglycerides and VLDL cholesterol is a very common pattern among HCE users. The reason is simple. VLDL cholesterol is not normally measured directly, but typically calculated based on fasting triglycerides, by dividing the fasting triglycerides measurement by 5. And there is an underlying reason for that - fasting triglycerides and VLDL cholesterol are actually very highly correlated, based on direct measurements of these two variables.

But if VLDL cholesterol is calculated based on fasting triglycerides (VLDL cholesterol  = fasting triglycerides / 5), how come the correlation is 0.999, and not a perfect 1? The reason is the rounding error in the measurements. Whenever you see a correlation this high (i.e., 0.999), it is reasonable to suspect that the source is an underlying linear relationship disturbed by rounding error.

Fasting triglycerides are probably the most useful measures on standard lipid panels. For example, fasting triglycerides below 70 mg/dl suggest a pattern of LDL particles that is predominantly of large and buoyant particles. This pattern is associated with a low incidence of cardiovascular disease (). Also, chronically high fasting triglycerides are a well known marker of the metabolic syndrome, and a harbinger of type 2 diabetes.

Where do large and buoyant LDL particles come from? They frequently start as "big" (relatively speaking) blobs of fat, which are actually VLDL particles. The photo is from the excellent book by Elliott & Elliott (); it shows, on the same scale: (a) VLDL particles, (b) chylomicrons, (c) LDL particles, and (d) HDL particles. The dark bar at the bottom of each shot is 1000 A in length, or 100 nm (A = angstrom; nm = nanometer; 1 nm = 10 A).


If you consume an excessive amount of carbohydrates, my theory is that your liver will produce an abnormally large number of small VLDL particles (also shown on the photo above), a proportion of which will end up as small and dense LDL particles. The liver will do that relatively quickly, probably as a short-term compensatory mechanism to avoid glucose toxicity. It will essentially turn excess glucose, from excess carbohydrates, into fat. The VLDL particles carrying that fat in the form of triglycerides will be small because the liver will be in a hurry to clear the excess glucose in circulation, and will have no time to produce large particles, which take longer to produce individually.

This will end up leading to excess triglycerides hanging around in circulation, long after they should have been used as sources of energy. High fasting triglycerides will be a reflection of that. The graphs below, also generated by HCE for John Doe, show how fasting triglycerides and VLDL cholesterol vary in relation to refined carbohydrate consumption. Again, the graphs are not identical in shape because of rounding error; the shapes are almost identical.


Small and dense LDL particles, in the presence of other factors such as systemic inflammation, will contribute to the formation of atherosclerotic plaques. Again, the main source of these particles would be an excessive amount of carbohydrates. What is an excessive amount of carbohydrates? Generally speaking, it is an amount beyond your liver’s capacity to convert the resulting digestion byproducts, fructose and glucose, into liver glycogen. This may come from spaced consumption throughout the day, or acute consumption in an unnatural form (a can of regular coke), or both.

Liver glycogen is sugar stored in the liver. This is the main source of sugar for your brain. If your blood sugar levels become too low, your brain will get angry. Eventually it will go from angry to dead, and you will finally find out what awaits you in the afterlife.

Should you be a healthy athlete who severely depletes liver glycogen stores on a regular basis, you will probably have an above average liver glycogen storage and production capacity. That will be a result of long-term compensatory adaptation to glycogen depleting exercise (). As such, you may be able to consume large amounts of carbohydrates, and you will still not have high fasting triglycerides. You will not carry a lot of body fat either, because the carbohydrates will not be converted to fat and sent into circulation in VLDL particles. They will be used to make liver glycogen.

In fact, if you are a healthy athlete who severely depletes liver glycogen stores on a regular basis, excess calories will be just about the only thing that will contribute to body fat gain. Your threshold for “excess” carbohydrates will be so high that you will feel like the whole low carbohydrate community is not only misguided but also part of a conspiracy against people like you. If you are also an aggressive blog writer, you may feel compelled to tell the world something like this: “Here, I can eat 300 g of carbohydrates per day and maintain single-digit body fat levels! Take that you low carbohydrate idiots!”

Let us say you do not consume an excessive amount of carbohydrates; again, what is excessive or not varies, probably dramatically, from individual to individual. In this case your liver will produce a relatively small number of fat VLDL particles, which will end up as large and buoyant LDL particles. The fat in these large VLDL particles will likely not come primarily from conversion of glucose and/or fructose into fat (i.e., de novo lipogenesis), but from dietary sources of fat.

How do you avoid consuming excess carbohydrates? A good way of achieving that is to avoid man-made carbohydrate-rich foods. Another is adopting a low carbohydrate diet. Yet another is to become a healthy athlete who severely depletes liver glycogen stores on a regular basis; then you can eat a lot of bread, pasta, doughnuts and so on, and keep your fingers crossed for the future.

Either way, fasting triglycerides will be strongly correlated with VLDL cholesterol, because VLDL particles contain both triglycerides (“encapsulated” fat, not to be confused with “free” fatty acids) and cholesterol. If a large number of VLDL particles are produced by one’s liver, the person’s fasting triglycerides reading will be high. If a small number of VLDL particles are produced, even if they are fat particles, the fasting triglycerides reading will be relatively low. Neither VLDL cholesterol nor fasting triglycerides will be zero though.

Now, you may be wondering, how come a small number of fat VLDL particles will eventually lead to low fasting triglycerides? After all, they are fat particles, even though they occur in fewer numbers. My hypothesis is that having a large number of small-dense VLDL particles in circulation is an abnormal, unnatural state, and that our body is not well designed to deal with that state. Use of lipoprotein-bound fat as a source of energy in this state becomes somewhat less efficient, leading to high triglycerides in circulation; and also to hunger, as our mitochondria like fat.

This hypothesis, and the theory outlined above, fit well with the numbers I have been seeing for quite some time from HCE users. Note that it is a bit different from the more popular theory, particularly among low carbohydrate writers, that fat is force-stored in adipocytes (fat cells) by insulin and not released for use as energy, also leading to hunger. What I am saying here, which is compatible with this more popular theory, is that lipoproteins, like adipocytes, also end up holding more fat than they should if you consume excess carbohydrates, and for longer.

Want to improve your health? Consider replacing things like bread and cereal with butter and eggs in your diet (). And also go see you doctor (); if he disagrees with this recommendation, ask him to read this post and explain why he disagrees.

Senin, 12 September 2011

Fasting blood glucose of 83 mg/dl and heart disease: Fact and fiction

If you are interested in the connection between blood glucose control and heart disease, you have probably done your homework. This is a scary connection, and sometimes the information on the Internetz make people even more scared. You have probably seen something to this effect mentioned:
Heart disease risk increases in a linear fashion as fasting blood glucose rises beyond 83 mg/dl.
In fact, I have seen this many times, including on some very respectable blogs. I suspect it started with one blogger, and then got repeated over and over again by others; sometimes things become “true” through repetition. Frequently the reference cited is a study by Brunner and colleagues, published in Diabetes Care in 2006. I doubt very much the bloggers in question actually read this article. Sometimes a study by Coutinho and colleagues is also cited, but this latter study is actually a meta-analysis.

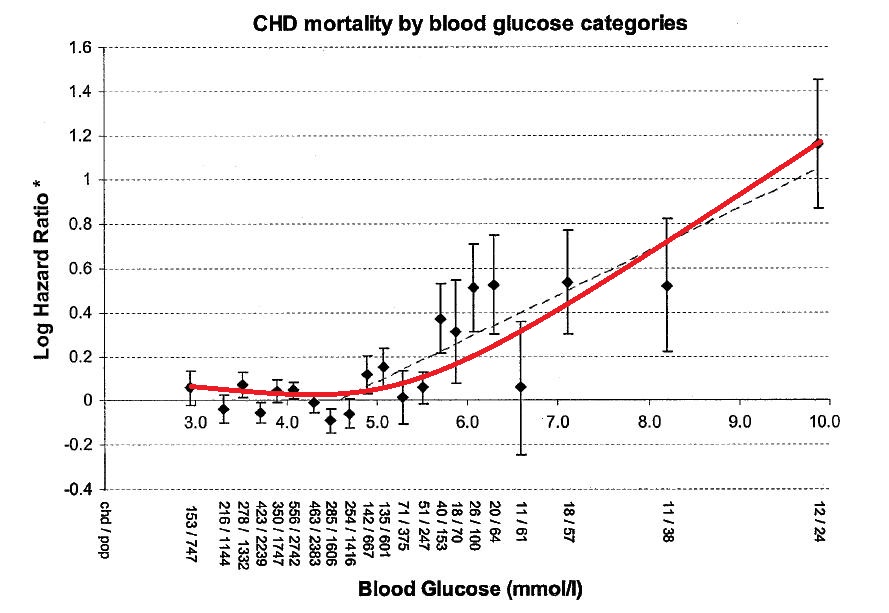
So I decided to take a look at the Brunner and colleagues study. It covers, among other things, the relationship between cardiovascular disease (they use the acronym CHD for this), and 2-hour blood glucose levels after a 50-g oral glucose tolerance test (OGTT). They tested thousands of men at one point in time, and then followed them for over 30 years, which is really impressive. The graph below shows the relationship between CHD and blood glucose in mmol/l. Here is a calculator to convert the values to mg/dl.


The authors note in the limitations section that: “Fasting glucose was not measured.” So these results have nothing to do with fasting glucose, as we are led to believe when we see this study cited on the web. Also, on the abstract, the authors say that there is “no evidence of nonlinearity”, but in the results section they say that the data provides “evidence of a nonlinear relationship”. The relationship sure looks nonlinear to me. I tried to approximate it manually below.


Note that CHD mortality really goes up more clearly after a glucose level of 5.5 mmol/l (100 mg/dl). But it also varies significantly more widely after that level; the magnitudes of the error bars reflect that. Also, you can see that at around 6.7 mmol/l (121 mg/dl), CHD mortality is on average about the same as at 5.5 mmol/l (100 mg/dl) and 3.5 mmol/l (63 mg/dl). This last level suggests an abnormally high insulin response, bringing blood glucose levels down too much at the 2-hour mark – i.e., reactive hypoglycemia, which the study completely ignores.

These findings are consistent with the somewhat chaotic nature of blood glucose variations in normoglycemic individuals, and also with evidence suggesting that average blood glucose levels go up with age in a J-curve fashion even in long-lived individuals.

We also know that traits vary along a bell curve for any population of individuals. Research results are often reported as averages, but the average individual does not exist. The average individual is an abstraction, and you are not it. Glucose metabolism is a complex trait, which is influenced by many factors. This is why there is so much variation in mortality for different glucose levels, as indicated by the magnitudes of the error bars.

In any event, these findings are clearly inconsistent with the statement that "heart disease risk increases in a linear fashion as fasting blood glucose rises beyond 83 mg/dl". The authors even state early in the article that another study based on the same dataset, to which theirs was a follow-up, suggested that:
…. [CHD was associated with levels above] a postload glucose of 5.3 mmol/l [95 mg/dl], but below this level the degree of glycemia was not associated with coronary risk.
Now, exaggerating the facts, to the point of creating fictitious results, may have a positive effect. It may scare people enough that they will actually check their blood glucose levels. Perhaps people will remove certain foods like doughnuts and jelly beans from their diets, or at least reduce their consumption dramatically. However, many people may find themselves with higher fasting blood glucose levels, even after removing those foods from their diets, as their bodies try to adapt to lower circulating insulin levels. Some may see higher levels for doing other things that are likely to improve their health in the long term. Others may see higher levels as they get older.

Many of the complications from diabetes, including heart disease, stem from poor glucose control. But it seems increasingly clear that blood glucose control does not have to be perfect to keep those complications at bay. For most people, blood glucose levels can be maintained within a certain range with the proper diet and lifestyle. You may be looking at a long life if you catch the problem early, even if your blood glucose is not always at 83 mg/dl (4.6 mmol/l). More on this on my next post.