Tampilkan postingan dengan label glucose. Tampilkan semua postingan

Kamis, 26 Mei 2016

Insulin responses to foods rich in carbohydrates and protein

Insulin is often presented as a hormone that is at the core of the diseases of civilization, particularly because of the insulin response elicited by foods rich in refined carbohydrates and sugars. What is often not mentioned is that protein also elicits an insulin response and so do foods where carbohydrates are mixed with fat. Sometimes the insulin responses are way more than one would expect based on the macronutrient compositions of the foods.

Holt et al. (1997; full reference at the end of this post) conducted a classic study of insulin responses. This study has been widely cited, and paints an interesting picture of differences in insulin responses to various foods. But you have to be careful where you look. There has been some confusion about the results because of the way they are often reported in places like Wikipedia and on various Internet sites that refer to the study.

The key thing to bear in mind when reviewing this study is that the amounts of food used were designed to have the same calorie content: 1000 kJ or 240 kcal (i.e., 240 calories). This led to wild variations in the size of the portions that are compared and their weight in grams. Also, some of the food portions are probably not what people usually eat in one sitting.

In Holt et al.’s (1997) study the participants were 41 lean and healthy university students. They were fed 1000 kJ (240 kcal) portions of the test foods on separate mornings after a 10-hour fast overnight. Blood insulin levels were measured at different times within a 120-minute period after each meal. An insulin score was then calculated from the area under the insulin response curve for each food; white bread was used as the reference food.

Part of Table 2 on page 1267 is shown below (the full text version of the paper is linked at the end of this post), just to illustrate the types and amounts of food served, and the macronutrient breakdown for each food. I hope you can see what I meant when I said that some of the food portions are probably not what people usually eat in one sitting. I don’t think it would be hard to find someone who would eat 158 g of beef steak in one sitting, but 333 g of fish is a little more difficult. Fish has a higher proportion of protein than beef steak, and thus is more satiating. The same goes for 625 g of orange, about 6 oranges. Foods that have more fat have more calories per gram; hence the smaller portions served for high-fat foods.


Table 4 of the article is a bit long, so I am providing it in two parts below. AUC stands for “area under the curve”. As you can see, for isocaloric portions of different foods (i.e., with the same amount of calories), there is a huge variation in insulin response. The insulin AUCs are shown on the second numeric column from the left. Also note that the insulin responses (AUC) for white bread varied in different meals. This complicates things a bit, but at least provides a more realistic view of the responses since each participant served as his or her own control.


Look at the third column from the right, which shows the insulin responses per gram of each food, compared with the response to white bread, always shown at the top for each group of related foods (e.g., protein-rich foods). The gram-adjusted response for whole-meal bread is rather high, and so is the glucose response. The gram-adjusted insulin response to potatoes is less than one-third of the response to white bread, even though the non-gram-adjusted glucose response is higher. The insulin response to beef is also less than one-third of the response to white bread, gram-for-gram. Even cheese leads to a gram-adjusted response that is about half the one for white bread, and I don’t think many people will eat the same amount of cheese in one sitting as they would do with white bread.

In summary, insulin responses to protein-rich foods are often 50 to 70 percent lower than responses to equivalent amounts of refined carbohydrate-rich foods. Also, insulin responses to unrefined carbohydrate-rich foods (e.g., potato, fruits) are often 70 to 90 percent lower than responses to equivalent amounts of refined carbohydrate-rich foods.

Why do insulin levels go up in response to dietary protein?

One of the reasons is that insulin is needed for tissue protein synthesis. That is, increased circulating protein (as amino acids) and insulin have a net anabolic effect, promoting muscle growth and inhibiting muscle breakdown. (Muscle protein synthesis and breakdown happen all the time; the net effect defines whether muscle grows or shrinks.) In this respect, insulin acts in conjunction with other hormones, such as growth hormone and insulin-like growth factor 1.

Reference:

Holt, S.H., Miller, J.C., & Petocz, P. (1997). An insulin index of foods: The insulin demand generated by 1000-kJ portions of common foods. American Journal of Clinical Nutrition, 66, 1264-1276.

Senin, 10 Desember 2012

Does tallness cause heart disease? No, but sex does

Popular beliefs about medical issues are sometimes motivated by a statistical phenomenon known as “spurious relationship”, among other names. Two variables X and Y are influenced by a third variable C, which leads to X and Y being correlated and thus the impression that X and Y are causally associated.

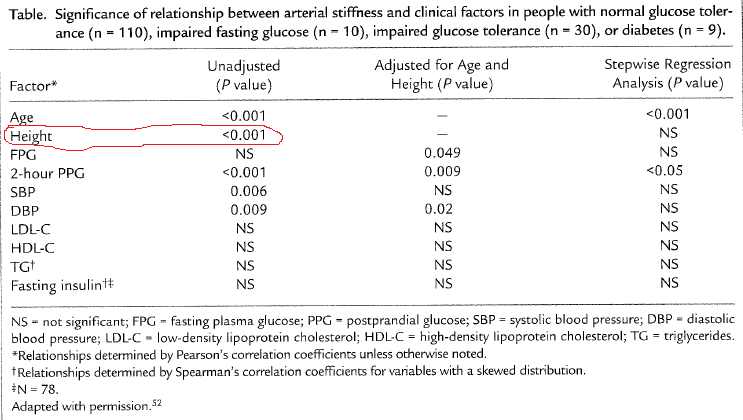
Take a look at the table below, which I blogged about in a previous post (). This table shows that there is a strong unadjusted correlation between height and arterial stiffness, a marker of heart disease. The likelihood that the correlation is due to chance is lower than one tenth of a percentage point (P<.001).


Interestingly, the authors of the study even use height as a control variable to narrow down the “true” causes of arterial stiffness (column with adjusted results), assuming that height did indeed influence arterial stiffness and what they found to be a key predictor of arterial stiffness, 2-hour postprandial glucose.

But there is no convincing evidence that height causes heart disease, with exception of pathological extremes – e.g., acromegaly. Extremes tend to influence statistical results somewhat, leading to conflicting conclusions that end up being disseminated by the popular media (). This is one of the sources of popular beliefs about medical issues.

Another, more important, source are real confounders. And this takes us back to the issue of height being associated with heart disease. In fact, height will typically be significantly associated with heart disease in almost any study that includes men and women and does not control for biological sex.

One of the reasons is that women overall tend to have a significantly lower incident of heart disease than men. The other is that height is significantly lower among women than men, on average, even though there are several women who are taller than the average man.

The table above was from a study including both sexes. Therefore, the strong association between height and arterial stiffness is a “reflection” of the strong association between being male and increased arterial stiffness. If one were to add a variable coded as 0 for male and 1 for female, and use it in a multivariate analysis of predictor of arterial stiffness, together with height, the effect of height would probably “disappear”.

Biological sex is the control variable, the “confounder”, that the authors should have used to narrow down the “true” causes of arterial stiffness (second column in the table). In the absence of biological sex, controlling for height accomplished something similar, but in a “wobbly” way, leaving many readers scratching their heads in confusion.

Senin, 19 September 2011

Being glucose intolerant may make you live only to be 96, if you would otherwise live to be 100

This comes also from the widely cited Brunner and colleagues study, published in Diabetes Care in 2006. They defined a person as glucose intolerant if he or she had a blood glucose level of 5.3-11 mmol/l after a 2-h post–50-g oral glucose tolerance test. For those using the other measurement system, like us here in the USA, that is a blood glucose level of approximately 95-198 mg/dl.

Quite a range, eh!? This covers the high end of normoglycemia, as well as pre- to full-blown type 2 diabetes.

In this investigation, called the Whitehall Study, 18,403 nonindustrial London-based male civil servants aged 40 to 64 years were examined between September 1967 and January 1970. These folks were then followed for over 30 years, based on the National Health Service Central Registry; essentially to find out whether they had died, and of what. During this period, there were 11,426 deaths from all causes; with 5,497 due to cardiovascular disease (48.1%) and 3,240 due to cancer (28.4%).

The graph below shows the age-adjusted survival rates against time after diagnosis. Presumably the N values refer to the individuals in the glucose intolerant (GI) and type 2 diabetic (T2DM) groups that were alive at the end of the monitoring period. This does not apply to the normoglycemic N value; this value seems to refer to the number of normoglycemic folks alive after the divergence point (5-10 years from diagnosis).


Note by the authors: “Survival by baseline glucose tolerance status diverged after 5-10 years of follow-up. Median survival differed by 4 years between the normoglycemic and glucose intolerant groups and was 10 years less in the diabetic compared with the glucose intolerant group.”

That is, it took between 5 and 10 years of high blood glucose levels for any effect on mortality to be noticed. One would expect at least some of the diagnosed folks to have done something about their blood glucose levels; a confounder that was not properly controlled for in this study, as far as I can tell. The glucose intolerant folks ended up living 4 years less than the normoglycemics, and 10 years more than the diabetics.

One implication of this article is that perhaps you should not worry too much if you experience a temporary increase in blood glucose levels due to compensatory adaptation to healthy changes in diet and lifestyle, such as elevated growth hormone levels. It seems unlikely that such temporary increase in blood glucose levels, even if lasting as much as 1 year, will lead to permanent damage to cells involved in glucose metabolism like the beta cells in the pancreas.

Another implication is that being diagnosed as pre-diabetic or diabetic is not a death sentence, as some people seem to take such diagnoses at first. Many of the folks in this study who decided to do something about their health following an adverse diagnosis probably followed the traditional advice for the treatment of pre-diabetes and diabetes, which likely made their health worse. (See Jeff O’Connell’s book Sugar Nation for a detailed discussion of what that advice entails.) And still, not everyone progressed from pre-diabetes to full-blow diabetes. Probably fewer refined foods available helped, but this does not fully explain the lack of progression to full-blow diabetes.

It is important to note that this study was conducted in the late 1960s. Biosynthetic insulin was developed in the 1970s using recombinant DNA techniques, and was thus largely unavailable to the participants of this study. Other treatment options were also largely unavailable. Arguably the most influential book on low carbohydrate dieting, by Dr. Atkins, was published in the early 1970s. The targeted use of low carbohydrate dieting for blood glucose control in diabetics was not widely promoted until the 1980s, and even today it is not adopted by mainstream diabetes doctors. To this I should add that, at least anecdotally and from living in an area where diabetes is an epidemic (South Texas), those people who carefully control their blood sugars after type 2 diabetes diagnoses, in many cases with the help of drugs, seem to see marked and sustained health improvements.

Finally, an interesting implication of this study is that glucose intolerance, as defined in the article, would probably not do much to change an outside observer’s perception of a long-living population. That is, if you take a population whose individuals are predisposed to live long lives, with many naturally becoming centenarians, they will likely still be living long lives even if glucose intolerance is rampant. Without carefully conducted glucose tolerance tests, an outside observer may conclude that a damaging diet is actually healthy by still finding many long-living individuals in a population consuming that diet.

Senin, 12 September 2011

Fasting blood glucose of 83 mg/dl and heart disease: Fact and fiction

If you are interested in the connection between blood glucose control and heart disease, you have probably done your homework. This is a scary connection, and sometimes the information on the Internetz make people even more scared. You have probably seen something to this effect mentioned:
Heart disease risk increases in a linear fashion as fasting blood glucose rises beyond 83 mg/dl.
In fact, I have seen this many times, including on some very respectable blogs. I suspect it started with one blogger, and then got repeated over and over again by others; sometimes things become “true” through repetition. Frequently the reference cited is a study by Brunner and colleagues, published in Diabetes Care in 2006. I doubt very much the bloggers in question actually read this article. Sometimes a study by Coutinho and colleagues is also cited, but this latter study is actually a meta-analysis.

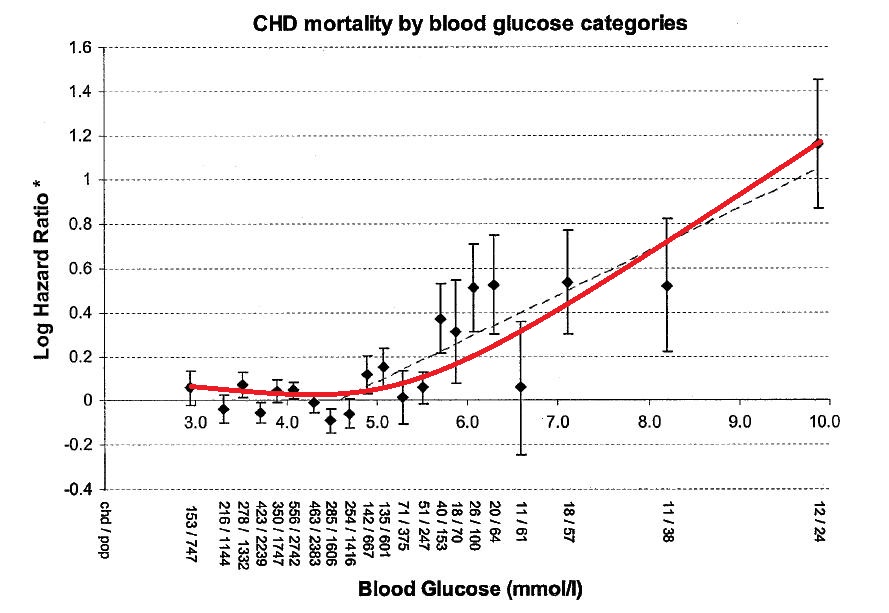
So I decided to take a look at the Brunner and colleagues study. It covers, among other things, the relationship between cardiovascular disease (they use the acronym CHD for this), and 2-hour blood glucose levels after a 50-g oral glucose tolerance test (OGTT). They tested thousands of men at one point in time, and then followed them for over 30 years, which is really impressive. The graph below shows the relationship between CHD and blood glucose in mmol/l. Here is a calculator to convert the values to mg/dl.


The authors note in the limitations section that: “Fasting glucose was not measured.” So these results have nothing to do with fasting glucose, as we are led to believe when we see this study cited on the web. Also, on the abstract, the authors say that there is “no evidence of nonlinearity”, but in the results section they say that the data provides “evidence of a nonlinear relationship”. The relationship sure looks nonlinear to me. I tried to approximate it manually below.


Note that CHD mortality really goes up more clearly after a glucose level of 5.5 mmol/l (100 mg/dl). But it also varies significantly more widely after that level; the magnitudes of the error bars reflect that. Also, you can see that at around 6.7 mmol/l (121 mg/dl), CHD mortality is on average about the same as at 5.5 mmol/l (100 mg/dl) and 3.5 mmol/l (63 mg/dl). This last level suggests an abnormally high insulin response, bringing blood glucose levels down too much at the 2-hour mark – i.e., reactive hypoglycemia, which the study completely ignores.

These findings are consistent with the somewhat chaotic nature of blood glucose variations in normoglycemic individuals, and also with evidence suggesting that average blood glucose levels go up with age in a J-curve fashion even in long-lived individuals.

We also know that traits vary along a bell curve for any population of individuals. Research results are often reported as averages, but the average individual does not exist. The average individual is an abstraction, and you are not it. Glucose metabolism is a complex trait, which is influenced by many factors. This is why there is so much variation in mortality for different glucose levels, as indicated by the magnitudes of the error bars.

In any event, these findings are clearly inconsistent with the statement that "heart disease risk increases in a linear fashion as fasting blood glucose rises beyond 83 mg/dl". The authors even state early in the article that another study based on the same dataset, to which theirs was a follow-up, suggested that:
…. [CHD was associated with levels above] a postload glucose of 5.3 mmol/l [95 mg/dl], but below this level the degree of glycemia was not associated with coronary risk.
Now, exaggerating the facts, to the point of creating fictitious results, may have a positive effect. It may scare people enough that they will actually check their blood glucose levels. Perhaps people will remove certain foods like doughnuts and jelly beans from their diets, or at least reduce their consumption dramatically. However, many people may find themselves with higher fasting blood glucose levels, even after removing those foods from their diets, as their bodies try to adapt to lower circulating insulin levels. Some may see higher levels for doing other things that are likely to improve their health in the long term. Others may see higher levels as they get older.

Many of the complications from diabetes, including heart disease, stem from poor glucose control. But it seems increasingly clear that blood glucose control does not have to be perfect to keep those complications at bay. For most people, blood glucose levels can be maintained within a certain range with the proper diet and lifestyle. You may be looking at a long life if you catch the problem early, even if your blood glucose is not always at 83 mg/dl (4.6 mmol/l). More on this on my next post.

Senin, 15 Agustus 2011

Book review: Sugar Nation

Jeff O’Connell is the Editor-in-Chief for Bodybuilding.com, a former executive writer for Men’s Health, and former Editor-in-Chief of Muscle & Fitness. He is also the author of a few bestselling books on fitness.

(Source: Bodybuilding.com)

It is obvious that Jeff is someone who can write, and this comes across very clearly in his new book, Sugar Nation.

Now, with a title like this, Sugar Nation, I was expecting a book discussing trends of sugar consumption in the USA, and the related trends in various degenerative diseases. So when I started reading the book I was slightly put off by what seemed to be a book about a very personal journey, written in the first person by the author.

Yet, after reading it for a while I was hooked, and literally could not put the book down. Jeff has managed to write something of a page-turner, combining a harrowing personal account with carefully researched scientific information, about a relatively rare form of type 2 diabetes.

Jeff has a genetic propensity to insulin resistance, just like his father did. What makes Jeff’s case a little unusual is that Jeff is thin, and apparently has difficulty gaining weight. The most common type of diabetes is type 2, and most of those who develop type 2 diabetes do so via the metabolic syndrome. Typically this involves becoming obese or overweight before getting diagnosed as a diabetic.

In fact, in a thin person who is insulin resistant it seems that body fat cells become resistant to the normal actions of insulin much sooner than in the obese. This essentially means that they start rejecting fat. This is a problem, because fat should either be stored in fat cells (adipocytes) or used for energy; as opposed to being deposited in other tissues or remaining in circulation. Apparently this makes it even more difficult for them to control glucose levels once insulin resistance sets in; there is no “cushion”, so to speak.

Still, Jeff appears to believe that his case was that of a skinny-fat person, where body fat percentage is a lot higher than expected based on a low body mass index, and where excess visceral fat is a main culprit. In fact, Jeff seems to think that most cases of thin folks who developed type 2 diabetes are like this, as they follow the metabolic syndrome progression pattern. Fasting triglycerides go up and HDL cholesterol goes down, among other things, but in a skinny-fat body.

Somewhat predictably, what Jeff found out is that, in his case, adopting a low carbohydrate diet made an enormous difference. In fact, it made the difference between having a fairly normal life versus constantly suffering through hypoglycemic episodes. And, at the stage in which Jeff caught the problem, he did not have to avoid all natural carbohydrate-rich foods, not even things like apples. (He had to control portions though.) It is the refined carbohydrate-rich foods that were the problem for him.

I must say that I disagree with a few of the statements in the book. For example, the author seems to believe that excess saturated fat and salt may be quite unhealthy. I think that foods rich in refined carbohydrates and sugars are much more of a problem; cut them out and often excess saturated fat and salt either cease to be a problem, or become healthy. Jeff doesn’t seem to think that excess omega-6 fats can also cause diabetes; I believe the opposite to be true, via a pro-inflammatory path.

Still, this is a great book on so many levels. Jeff meticulously records his experience dealing with doctors, most of whom seem to be clueless as to what to do to prevent the damage that is caused by abnormally high glucose levels. This happens even though diabetes is those doctors’ main area of expertise. He talks about himself with complete abandon, and manages to mix that up with quite a lot of relevant research on diabetes. He gives us an insider’s view of the professional bodybuilding culture, including its use of insulin injections. His description of the Amish is very interesting and somewhat surprising.

For these reasons and a few others, I think this is a great book, and highly recommend it!

Senin, 01 Agustus 2011

There is no doubt that abnormally elevated insulin is associated with body fat accumulation

For as long as diets existed there have been influential proponents, or believers, who at some point had what they thought were epiphanies. From that point forward, they disavowed the diets that they formally endorsed. Low carbohydrate dieting seems to be in this situation now. Among other things, it has been recently “discovered” that the idea that insulin drives fat into body fat cells is “wrong”.

Based on some of the comments I have been receiving lately, apparently a few readers think that I am one of those “enlightened”. If you are interested in what I have been eating, for quite some time now, just click on the link at the top of this blog that refers to my transformation. It is essentially high in all macronutrients on days that I exercise, and low in carbohydrates and calories on days that I don’t. It is a cyclic approach that works for me; calorie surpluses on some days and calorie deficits on other days.

But let me set the record straight regarding what I think: there is no doubt that insulin is associated with body fat accumulation. I was told that an influential health blogger (whom I respect a lot) denied this recently, going to the extreme of saying that no professional metabolism or endocrinology researcher believes in it, but I couldn’t find any evidence of that statement. It is not hard at all to find professional metabolism and endocrinology researchers who have asserted that insulin is associated with body fat accumulation, based on very reliable evidence. Actually, this is Biochemistry 101.

What I think is truly unclear is whether insulin spikes associated with carbohydrate-rich foods in general are the cause of obesity. This idea is, indeed, probably wrong given the evidence we have from various human populations whose members consume plenty of non-industrialized carbohydrate-rich foods. On a related note, I particularly disagree with the notion that the pancreas gets tired over time due to having to secrete insulin in bursts, which seems to also be one of the foundations on which many low carbohydrate diet varieties rest.

As with almost everything related to health, the role of insulin in body fat gain is complex, and part of that complexity is due to the nonlinear relationship between body fat gain and postprandial insulin release. Industrial carbohydrate-rich foods have a much higher glycemic load than natural carbohydrate-rich foods, even though their glycemic index may be the same in some cases. In other words, the quantity of easily digestible carbohydrates per gram is much higher in industrial carbohydrate-rich foods.

In normoglycemic folks, this leads to an abnormally elevated insulin response, among other hormonal responses. For example, circulating growth hormone, which promotes body fat loss, is inversely correlated with circulating insulin. Insulin drives fat, typically from dietary sources of fat, into adipocytes. That fat may also come from excess carbohydrates, packaged into VLDL particles.

Under normal circumstances, that would be fine, since our body is designed to store fat and release it as needed. But the abnormal insulin response elicited by industrial carbohydrate-rich foods, together with other hormonal responses, leads to a little more body fat accumulation, and for longer, than it should. And I’m talking here about people without any metabolic damage. Saturated and monounsaturated fats are healthy when eaten, but when they are stored as excess body fat, they become pro-inflammatory.

Body fat is like an organ, secreting many hormones into the bloodstream, several of which are pro-inflammatory. One of those pro-inflammatory hormones, which I believe is closely linked with many diseases of civilization, is tumor necrosis factor. (The acronym is now TNF. Apparently the “-alpha” after its name and acronym has been dropped recently.) Dietary fat, particularly saturated fat, seems to be anti-inflammatory. In other words, body fat accumulation is the problem. You only need 30 g/d of excess body fat accumulation to gain around 24 lbs of fat per year. Over three years, that will add up to over 70 lbs of body fat.

In my view, ultimately it is excess inflammation (which is, in essence, a vascular response) that is at the source of most of the diseases of civilization.

That is where the nonlinearity comes in. Insulin is healthy up to a point. Beyond that, it starts causing health problems, over time. And one of the main mechanisms by which it does so is via excessive body fat accumulation, with different damage threshold levels for different people. Insulin may decrease appetite as it goes up, but it increases it if goes down too much. If it goes up abnormally, typically it will go down too much. As it reaches a trough it induces hypoglycemia, even if mildly.

Take a look at the graph below, from this post showing the glucose variations in normoglycemic individuals. There is a lot of variation among different individuals, but it is clear that the magnitude of the hypoglycemic dips is inversely correlated with the magnitude of the glucose spikes. That inverse correlation is due primarily to the effect of insulin. Under normal circumstances, a decrease in circulating insulin would promote an increase in free fatty acids in circulation, which would normally have a suppressing effect on hunger in the hours after a meal. But industrial carbohydrate-rich foods lead to increases and decreases in glucose and insulin that are too steep, causing the opposite effect.


You may ask: why do you keep talking about industrial carbohydrate-rich foods? Why not talk about industrial protein- or fat-rich foods as well? The reason is that the food industry has not been very successful at producing industrial protein- or fat-rich foods that are palatable without adding a lot of carbohydrate to them.

More often than not they need enough carbohydrate added in the form of sugar to become truly addictive.

Senin, 02 Mei 2011

Strength training plus fasting regularly, and becoming diabetic!? No, it is just compensatory adaptation at work

One common outcome of doing glycogen-depleting exercise (e.g., strength training, sprinting) in combination with intermittent fasting is an increase in growth hormone (GH) levels. See this post for a graph showing the acute effect on GH levels of glycogen-depleting exercise. This effect applies to both men and women, and is generally healthy, leading to improvements in mood and many health markers.

It is a bit like GH therapy, with GH being “administered” to you by your own body. Both glycogen-depleting exercise and intermittent fasting increase GH levels; apparently they have an additive effect when done together.

Still, a complaint that one sees a lot from people who have been doing glycogen-depleting exercise and intermittent fasting for a while is that their fasting blood glucose levels go up. This is particularly true for obese folks (after they lose body fat), as obesity tends to be associated with low GH levels, although it is not restricted to the obese. In fact, many people decide to stop what they were doing because they think that they are becoming insulin resistant and on their way to developing type 2 diabetes. And, surely enough, when they stop, their blood glucose levels go down.

Guess what? If your blood glucose levels are going up quite a bit in response to glycogen-depleting exercise and intermittent fasting, maybe you are one of the lucky folks who are very effective at increasing their GH levels. The blood glucose increase effect is temporary, although it can last months, and is indeed caused by insulin resistance. An HbA1c test should also show an increase in hemoglobin glycation.

Over time, however, you will very likely become more insulin sensitive. What is happening is compensatory adaptation, with different short-term and long-term responses. In the short term, your body is trying to become a more efficient fat-burning machine, and GH is involved in this adaptation. But in the short term, GH leads to insulin resistance, probably via actions on muscle and fat cells. This gradually improves in the long term, possibly through a concomitant increase in liver insulin sensitivity and glycogen storage capacity.

This is somewhat similar to the response to GH therapy.

The figure below is from Johannsson et al. (1997). It shows what happened in terms of glucose metabolism when a group of obese men were administered recombinant GH for 9 months. The participants were aged 48–66, and were given in daily doses the equivalent to what would be needed to bring their GH levels to approximately what they were at age 20. For glucose, 5 mmol is about 90 mg, 5.5 is about 99, and 6 is about 108. GDR is glucose disposal rate; a measure of how quickly glucose is cleared from the blood.


As you can see, insulin sensitivity initially goes down for the GH group, and fasting blood glucose goes up quite a lot. But after 9 months the GH group has better insulin sensitivity. Their GDR is the same as in the placebo group, but with lower circulating insulin. The folks in the GH group also have significantly less body fat, and have better health markers, than those who took the placebo.

There is such a thing as sudden-onset type 2-like diabetes, but it is very rare (see Michael’s blog). Usually type 2 diabetes “telegraphs” its arrival through gradually increasing fasting blood glucose and HbA1c. However, those normally come together with other things, notably a decrease in HDL cholesterol and an increase in fasting triglycerides. Folks who do glycogen-depleting exercise and intermittent fasting tend to see the opposite – an increase in HDL cholesterol and a decrease in triglycerides.

So, if you are doing things that have the potential to increase your GH levels, a standard lipid panel can help you try to figure out whether insulin resistance is benign or not, if it happens.

By the way, GH and cortisol levels are correlated, which is often why some associate responses to glycogen-depleting exercise and intermittent fasting with esoteric nonsense that has no basis in scientific research like “adrenal fatigue”. Cortisol levels are meant to go up and down, but they should not go up and stay up while you are sitting down.

Avoid chronic stress, and keep on doing glycogen-depleting exercise and intermittent fasting; there is overwhelming scientific evidence that these things are good for you.

Sabtu, 15 Januari 2011

Do you lose muscle if you lift weights after a 24-hour fast? Probably not if you do that regularly

Compensatory adaptation (CA) is an idea that is useful in the understanding of how the body reacts to inputs like dietary intake of macronutrients and exercise. CA is a complex process, because it involves feedback loops, but it leads to adaptations that are fairly general, applying to a large cross-section of the population.

A joke among software developers is that the computer does exactly what you tell it to do, but not necessarily what you want it to do. Similarly, through CA your body responds exactly to the inputs you give it, but not necessarily in the way you would like it to respond. For example, a moderate caloric deficit may lead to slow body fat loss, while a very high caloric deficit may bring body fat loss to a halt.

Strength training seems to lead to various adaptations, which can be understood through the lens provided by CA. One of them is a dramatic increase in the ability of the body to store glycogen, in both liver and muscle. Glycogen is the main fuel used by muscle during anaerobic exercise. Regular strength training causes, over time, glycogen stores to more than double. And about 2.6 the amount of glycogen is also stored as water.

When one looks bigger and becomes stronger as a result of strength training, that is in no small part due to increases in glycogen and water stored. More glycogen stored in muscle leads to more strength, which is essentially a measure of one’s ability to move a certain amount of weight around. More muscle protein is also associated with more strength.

Thinking in terms of CA, the increase in the body’s ability to store glycogen is to be expected, as long as glycogen stores are depleted and replenished on a regular basis. By doing strength training regularly, you are telling your body that you need a lot of glycogen on a regular basis, and the body responds. But if you do not replenish your glycogen stores on a regular basis, you are also sending your body a conflicting message, which is that dietary sources of the substances used to make glycogen are not readily available. Among the substances that are used to make glycogen, the best seems to be the combination of fructose and glucose that one finds in fruits.

Let us assume a 160-lbs untrained person, John, who stored about 100 g of glycogen in his liver, and about 500 g in his muscle cells, before starting a strength training program. Let us assume, conservatively, that after 6 months of training he increased the size of his liver glycogen tank to 150 g. Muscle glycogen storage was also increased, but that is less relevant for the discussion in this post.

Then John fasted for 24 hours before a strength training session, just to see what would happen. While fasting he went about his business, doing light activities, which led to a caloric expenditure of about 100 calories per hour (equivalent to 2400 per day). About 20 percent of that, or 20 calories per hour, came from a combination of blood glucose and ketones. Contrary to popular belief, ketones can always be found in circulation. If only glucose were used, 5 g of glucose per hour would be needed to supply those 20 calories.

During the fast, John’s glucose needs, driven primarily by his brain’s needs, were met by conversion of liver glycogen to blood glucose. His muscle glycogen was pretty much “locked” during the fast; because he was doing only light activities, which rely primarily on fat as fuel. Muscle glycogen is “unlocked” through anaerobic exercise, of which strength training is an instance.

One of the roles of ketones is to spare liver glycogen, delaying the use of muscle protein to make glucose down the road, so the percentage of ketones in circulation in John’s body increased in a way that was inversely proportional to stored liver glycogen. According to this study, after 72 hours fasting about 25 percent of the body’s glucose needs are met by ketones. (This may be an underestimation.)

If we assume a linear increase in ketone concentration, this leads to a 0.69 percent increase in circulating ketones for every 2-hour period. (This is a simplification, as the increase is very likely nonlinear.) So, when we look at John’s liver glycogen tank, it probably went down in a way similar to that depicted on the figure below. The blue bars show liver glycogen at the end of each 2-hour period. The red bars show the approximate amount of glucose consumed during each 2-hour period. Glucose consumed goes down as liver glycogen decreases, because of the increase in blood ketones.


As you can see, after a 24-hour fast, John had about 35 g of glycogen left, which is enough for a few extra hours of fasting. At the 24-hour mark the body had no need to be using muscle protein to generate glucose. Maybe some of that happened, but probably not much if John was relaxed during the fast. (If he was stressed out, stress hormones would have increased blood glucose release significantly.) From the body’s perspective, muscle is “expensive”, whereas body fat is “cheap”. And body fat, converted to free fatty acids, is what is used to produce ketones during a fast.

Blood ketone concentration does not go up dramatically during a 24-hour fast, but it does after a 48-hour fast, when it becomes about 10 times higher. This major increase occurs primarily to spare muscle, including heart muscle. If the increase is much smaller during a 24-hour fast, one can reasonably assume that the body is not going to be using muscle during the fast. It can still rely on liver glycogen, together with a relatively small amount of ketones.

Then John did his strength training, after the 24-hour fast. When he did that, the muscles he used in the exercise session converted locally stored glycogen into lactate. A flood of lactate was secreted into the bloodstream, which was used by his liver to produce glucose and also to replenish liver glycogen a bit. Again, at this stage there was no need for John’s body to use muscle protein to generate glucose.

Counterintuitive as this may sound, the more different muscles John used, the more lactate was made available. If John did 20 sets of isolated bicep curls, for example, his body would not have released enough lactate to meet its glucose needs or replenish liver glycogen. As a result, stress hormones would go up a lot, and his body would send him some alarm signals. One of those signals is a feeling of “pins and needles”, which is sometimes confused with the symptoms of a heart attack.

John worked out various muscle groups for 30 minutes or so, and he did not even feel fatigued. He felt energetic, in part because his blood glucose went up a lot, peaking at 150 mg/dl, to meet muscle needs. This elevated blood glucose was caused by his liver producing blood glucose based on lactate and releasing it into his blood. Muscle glycogen was depleted as a result of that.

Do you lose any muscle if you lift weights after a 24-hour fast?

I don’t think so, if you deplete your glycogen stores by doing strength training on a regular basis, and also replenish them on a regular basis. In fact, your liver glycogen tank will increase in size, and you may find yourself being able to fast for many hours without feeling hungry.

You will feel hungry after the strength training session following the fast though; probably ravenous.

References

Brooks, G.A., Fahey, T.D., & Baldwin, K.M. (2005). Exercise physiology: Human bioenergetics and its applications. Boston, MA: McGraw-Hill.

Wilmore, J.H., Costill, D.L., & Kenney, W.L. (2007). Physiology of sport and exercise. Champaign, IL: Human Kinetics.